Accurate Stockpile Volume Calculations Using Drone Imagery
Why Drone Imagery Changes the Game for Stockpile Measurement
Measuring stockpile volume has long been a challenge for industries that handle bulk materials. Gravel, coal, ore, agricultural products, and construction aggregates all need regular inventory checks. Traditional methods involve ground surveys with total stations or GPS rovers, which can be slow, labor-intensive, and sometimes dangerous. Workers walk across unstable piles, often in poor weather or on steep slopes. The process yields point data that must be interpolated into a surface, introducing uncertainty.
Drone imagery offers a different approach. A small unmanned aircraft flies over the stockpile in minutes, capturing hundreds of overlapping photographs. Modern photogrammetry software processes these images into a dense point cloud or a digital surface model (DSM). From that model, volume calculations become a matter of comparing the surface to a reference plane or a pre-existing base surface. The result is faster, safer, and often more accurate than conventional methods.
Yet good results depend on following a reliable workflow. Each step, from flight planning to data processing, has pitfalls that can throw off the numbers. This article walks through the practical steps to measure stockpile volume with drone imagery, with attention to what to watch at each stage.
Step 1: Plan the Flight for Coverage and Accuracy
Before the drone leaves the ground, think about what the final surface model needs. The stockpile's shape, size, and surrounding terrain all influence the flight plan. A long, low ridge of gravel requires a different approach than a tall conical stockpile of sand.
Key considerations include:
- Overlap and sidelap: For photogrammetry to work, images must overlap by at least 75-80% front overlap and 60-70% side overlap. Less overlap means the software cannot reliably match features between images, leading to gaps or errors in the point cloud.
- Ground sample distance (GSD): This is the size of one pixel on the ground. For stockpile work, a GSD of 1-3 cm is typical. Lower GSD (finer detail) improves accuracy but requires flying lower and slower, increasing flight time.
- Flight altitude and terrain: Fly high enough to capture the entire stockpile in a single pass, but low enough to maintain good GSD. If the stockpile sits on uneven ground, consider a terrain-aware flight plan that keeps the drone at a constant height above the ground.
- Ground control points (GCPs): For the highest accuracy, place physical targets on the ground around the stockpile and survey their coordinates with a GPS. These GCPs tie the drone model to real-world coordinates and correct for any drift in the drone's onboard GPS. For routine volume checks where relative accuracy matters more than absolute position, GCPs may be optional, but they are strongly recommended when volumes must match ground-truth measurements.
What to watch: Overlap that is too low, or GSD that is too coarse, will produce a surface model with holes or blurred edges. Always check the flight plan against the stockpile's dimensions and the drone's camera specifications.
Step 2: Capture the Imagery in Good Conditions
The quality of the raw images directly limits the quality of the final model. Even with a perfect flight plan, poor lighting or motion blur can ruin the data.
Fly in overcast or soft light if possible. Harsh shadows, especially from a low sun, make it hard for photogrammetry software to match features across images. Shadows shift as the sun moves, introducing inconsistencies. Wind is another factor: strong gusts can cause the drone to pitch and roll, blurring images. Most consumer and prosumer drones have mechanical shutters that handle moderate wind, but sustained gusts above 20-25 mph may degrade image sharpness.
Set the camera to a fast shutter speed - 1/1000th of a second or faster - to freeze motion. Use a fixed aperture and keep ISO as low as possible to reduce noise. If the drone has a mechanical shutter, use it; rolling shutters can introduce distortion on fast-moving objects.
What to watch: Blurry images are the number one cause of failed or inaccurate models. Review a few sample images in the field before the drone lands. If they look soft, adjust settings or wait for calmer conditions.
Step 3: Process the Images into a Point Cloud or Surface Model
Back at the office, photogrammetry software does the heavy lifting. The software identifies common points in overlapping images, triangulates their positions, and builds a dense set of 3D points. This point cloud represents the stockpile's surface. From there, the software can generate a digital surface model (DSM) or a mesh.
Processing steps typically include:
- Import and align images: Load the images and their GPS metadata. The software uses the drone's geotags to roughly position each image.
- Aerial triangulation: The software finds tie points between images and solves for camera position and orientation. This step may take several minutes, depending on image count and overlap.
- Dense point cloud generation: Every pixel in every image that has a reliable match in other images becomes a 3D point. For a typical stockpile, this yields millions of points.
- Build the DSM: The software interpolates the point cloud into a continuous surface. You can choose the resolution of this surface; finer resolution retains more detail but requires more computing power.
What to watch: Check the point cloud for holes or noisy areas. Vegetation, water, or reflective surfaces (like wet coal) can confuse the matching algorithms. If the stockpile has grass growing on it, consider filtering out points below a certain height or using a classifier to remove vegetation. Also verify that the coordinate system matches your reference surface.
Step 4: Define the Reference Surface
Volume is the difference between the stockpile surface and a reference surface. That reference is usually the ground beneath the stockpile. If you have a clean survey of the empty ground before the stockpile was placed, you can subtract that surface. If not, you must infer the ground from the current data.
The simplest method is to define a horizontal plane at the average elevation of the ground around the stockpile. This works well for stockpiles on flat, uniform ground. For piles on sloping terrain, a plane will introduce error. A better approach is to create a triangulated surface from points around the perimeter of the stockpile, excluding the pile itself. This perimeter surface is then subtracted from the stockpile surface.
What to watch: The reference surface is the biggest source of error in volume calculations. A small error in the reference elevation translates directly into a volume error. If you are comparing volumes over time, always use the same reference surface. Do not change the method between surveys.
Step 5: Calculate the Volume and Assess Accuracy
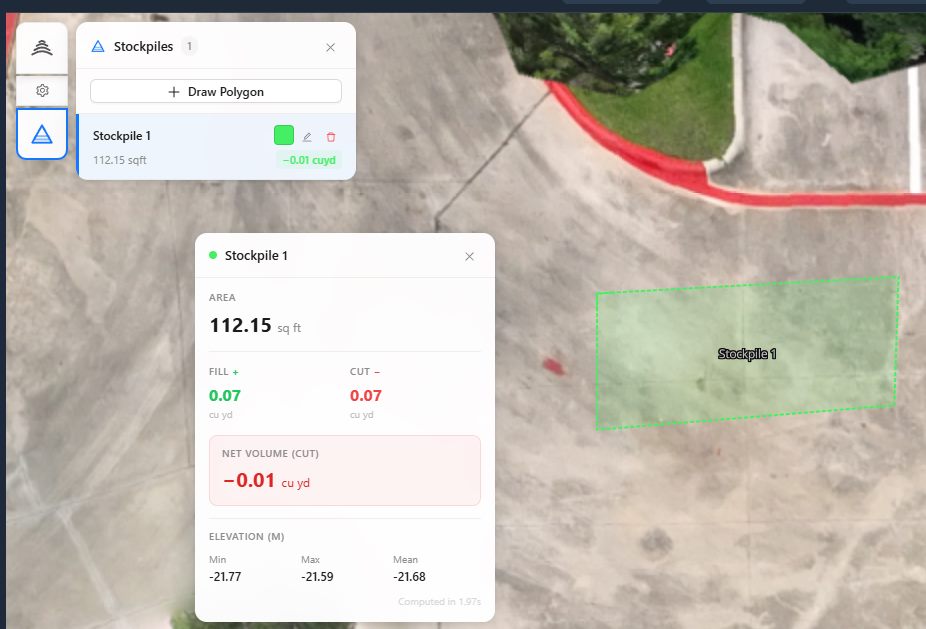
With the stockpile surface and reference surface ready, the software computes the volume. Most photogrammetry platforms do this automatically: they sum the volume of each cell in the grid (or each triangle in a mesh) between the two surfaces.
Volume can be reported as cut (material above the reference) and fill (voids below the reference, if any). For a stockpile, you are interested in cut volume only.
Accuracy assessment is often overlooked but critical. Compare the drone-derived volume to a known reference, such as a weighbridge ticket or a ground survey, if available. Even without a reference, you can assess precision by processing the same dataset twice with slightly different parameters and comparing results. A difference of more than 2-3% suggests a problem in the workflow.
What to watch: Volume numbers are not sacred. They are estimates, and their accuracy depends on every step in the chain. Do not report a single number to too many decimal places; a volume of 12,345.67 cubic meters implies a precision that the method cannot deliver. Round to a sensible figure, such as the nearest 100 cubic meters, unless you have strong ground truth.
Making It Routine with a Reliable Partner
For organizations that need regular stockpile volume calculations, repeating this workflow consistently matters more than any single measurement. Standardizing flight height, camera settings, processing parameters, and reference surfaces ensures that changes in volume over time reflect real changes in stockpile quantity, not shifts in methodology.
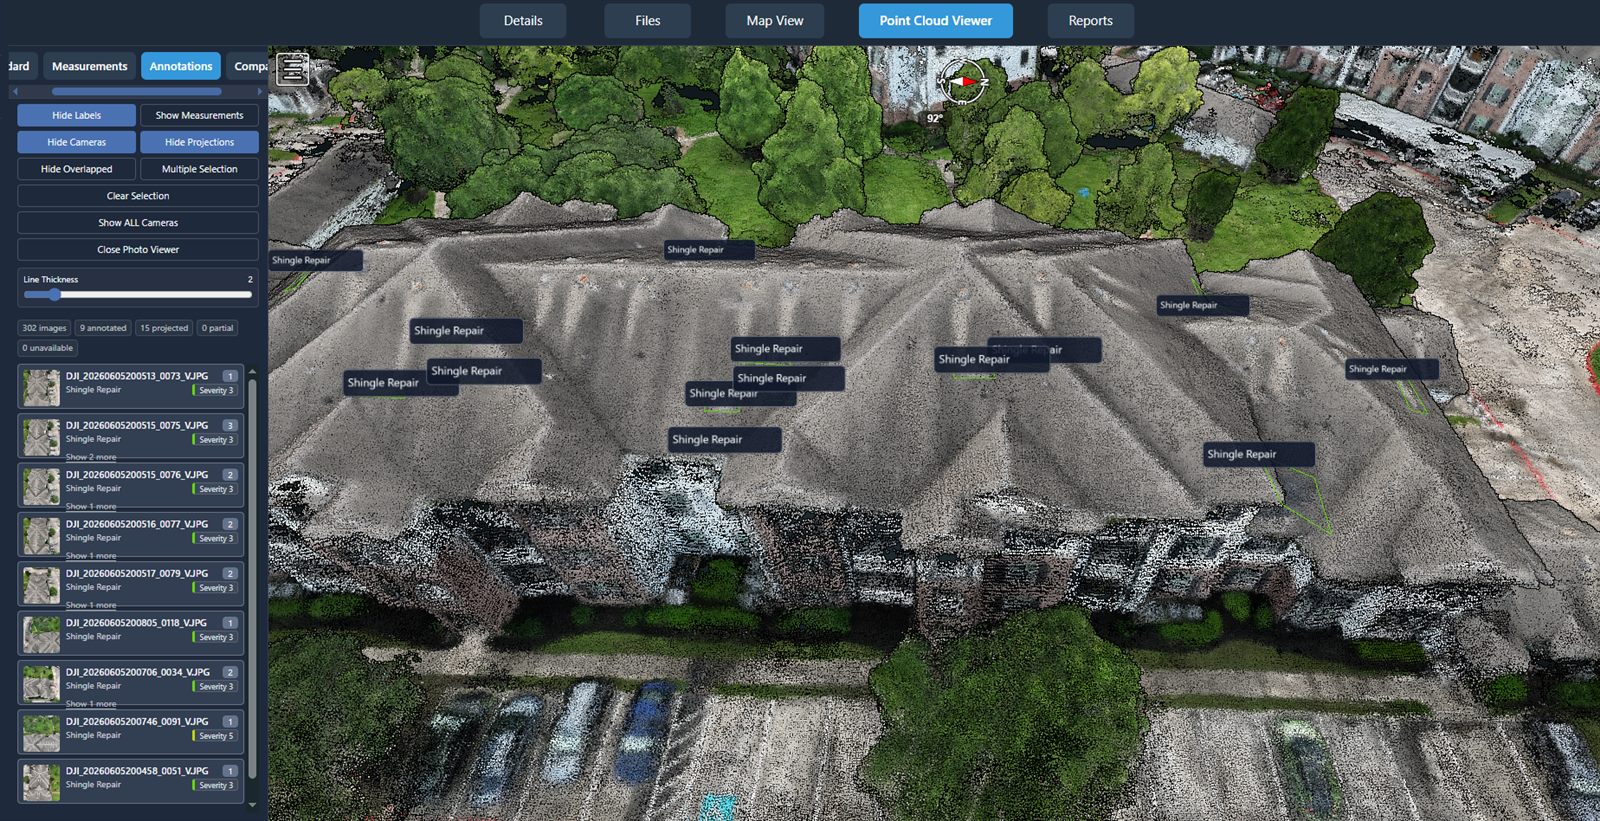
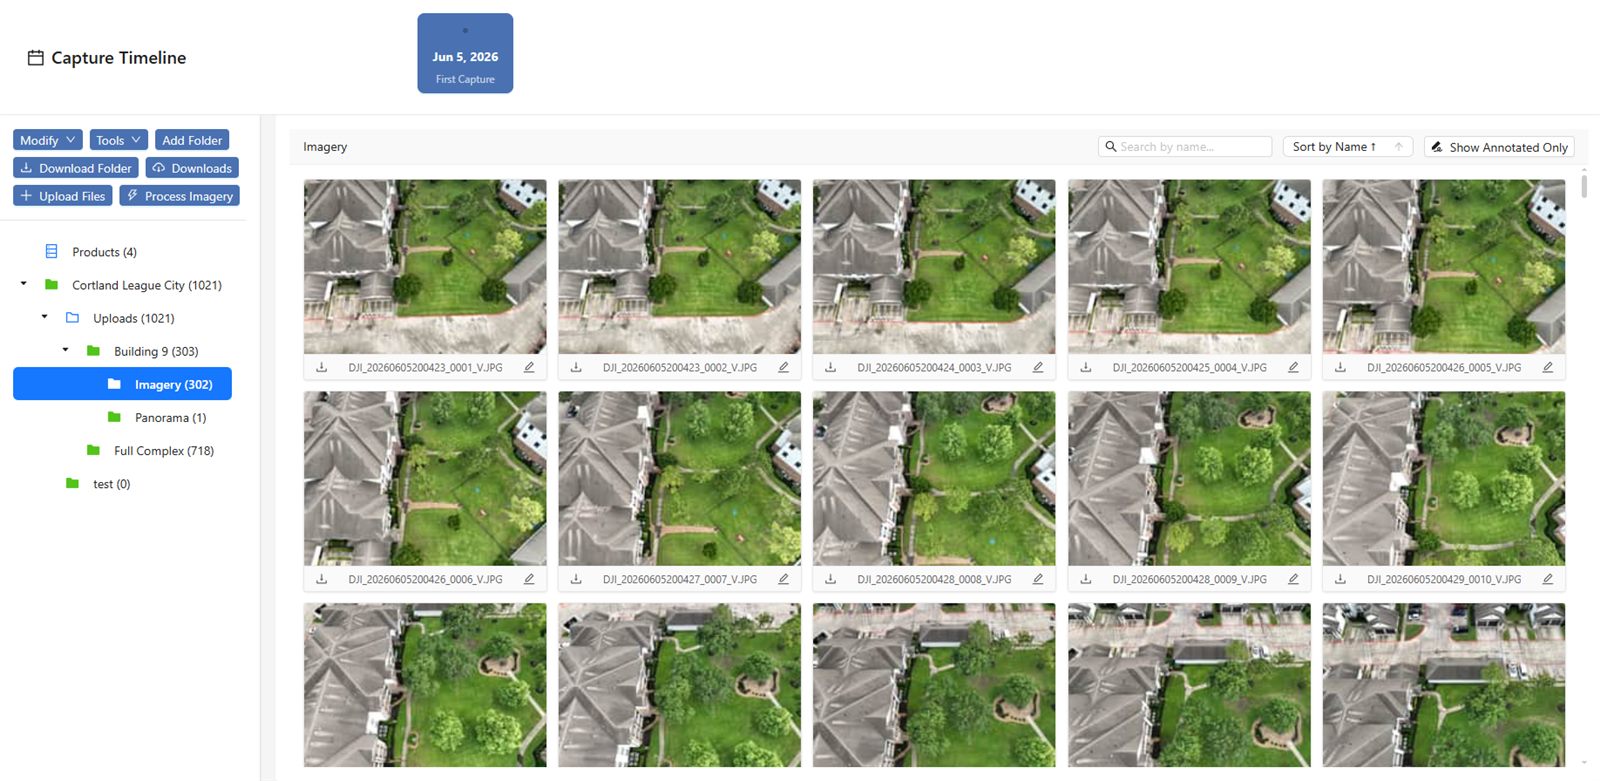
Companies like National Drone Services provide a platform for uploading, processing, organizing, visualizing, comparing, measuring, and sharing drone aerial data, with nationwide turnkey capture. Such a platform can help standardize and streamline the entire process, from flight management to final reporting. Using a consistent workflow each time, whether you fly in-house or work with a partner, builds confidence in the numbers.
Drone imagery has made stockpile volume calculations faster and safer than traditional methods. By planning carefully, capturing clean images, processing them rigorously, and defining a solid reference surface, you can obtain reliable volumes that support inventory management, sales reporting, and operational decisions. The technology is accessible, but the discipline of following each step with attention to detail is what separates a useful number from a misleading one.
Whether you are measuring a single stockpile or managing dozens, the same principles apply. National Drone Services offers a platform that can handle the data management side, but the quality of the result still starts with a good flight plan and ends with a careful review of the numbers. With practice, the workflow becomes second nature, and the volume reports become a trusted part of your operation.
National Drone Services on social media
 Facebook